Bitcoin's $80K Risk: The Key Level to Watch - Thoughts?
Bitcoin's $80K Tango: A Last Chance or a Last Gasp?
Bitcoin's been doing the limbo under $100K for what feels like an eternity. The question isn't just "when moon," but "is this rally even real?" We've seen the headlines—bearish bets piling up, analysts calling for a $10,000 bottom, the usual crypto-apocalypse fare. But let’s strip away the noise and look at what the data is actually telling us about this dance around the $80,000 mark.
One article highlights a potential drop below $80,000 by early 2026, citing increased bearish positioning in the options market. Traders are apparently loading up on put options with strike prices at $84,000 and $80,000, signaling growing skepticism. The options skew, which measures the relative cost of puts versus calls, has also taken a nosedive. This isn't just random noise; it suggests that sophisticated investors are willing to pay a premium to protect themselves from downside risk. But here's the thing: options markets are sentiment indicators, not crystal balls. They reflect probabilities, not certainties. And sentiment can shift faster than a Shiba Inu meme goes viral.
On-Chain and Technical Analysis
On-Chain Skepticism
The on-chain data isn't exactly screaming "bull market," either. Active Bitcoin addresses, measured using a 100-day moving average, have been declining since February 2025, even when the price was hitting new all-time highs. This divergence—price up, activity down—is a classic warning sign. It suggests that the recent rally from $80K to $91K might be driven by fewer participants, possibly whales or institutional players, rather than a broad-based resurgence of retail interest. Sustained rallies need fresh blood, new users, and renewed network activity. Without it, this bounce could be nothing more than a bear market mirage.
Technical Resilience and Key Levels
But before we bury Bitcoin completely, let's look at the technical picture. The daily chart shows a clear bounce from the $80K demand zone, pushing the price back into the $90K–$93K resistance block. The asset is still stuck inside a descending channel, struggling to break above the upper trendline. The 100-day and 200-day moving averages (both hovering around $108K) are looming overhead, acting as significant resistance. As long as Bitcoin remains below these MAs, the broader trend remains bearish. The Relative Strength Index (RSI) is also indecisive, sitting around 45 and failing to break into bullish territory. This makes the $90K–$95K area the critical short-term battleground. A clean break and daily close above this region could signal a trend shift. Until then, this move remains a bear market rally inside a larger downtrend.
Short-Term 4-Hour Chart Analysis
Zooming in on the 4-hour chart, Bitcoin appears to have formed a breakout and retest pattern from a descending trendline that started in late October. After several rejections at $94K, BTC pierced above this trendline but is now hovering around $91K again. While the local market structure looks constructive, a bearish divergence is evident on the RSI, and momentum is weakening. If buyers fail to hold above $90K in the coming sessions, a drop back toward the $80K zone is on the table. Conversely, a solid push above $94K would quickly put $100K+ targets back in play.
I've looked at hundreds of these charts, and the indecision is palpable. The bulls and bears are locked in a tug-of-war, and the outcome is far from certain.
The McGlone $10K Scenario: Is it even possible?
Then there's the Mike McGlone doomsday scenario: Bitcoin crashing to $10,000. He argues that the entire crypto space needs a "purging," drawing parallels to the dot-com bubble. He points to speculative excesses, like Dogecoin's multi-billion dollar market cap, and ties Bitcoin's fate to a broader market correction intensified by U.S. policy shifts. He even challenges Bitcoin's "digital gold" narrative, arguing that it's more of a leveraged beta play that got burned.
Key Arguments for a $10K Bitcoin
His $10,000 target hinges on several key arguments: speculative excess, macroeconomic reset, the "digital gold" myth, and mean reversion. He sees rampant overhype in crypto, spotlighting assets like Dogecoin. "Dogecoin still has $20 billion in market cap," he said. "It’s basically a joke. It should go to zero." For retail investors, this suggests Bitcoin’s price may be propped up by unsustainable enthusiasm rather than intrinsic value. One expert Predicts BTC Price Drop to $10,000.
The Importance of Community Sentiment
Now, I'm not saying McGlone is right—or wrong. But his analysis is a useful counterpoint to the perpetual optimism that pervades the crypto space. He's basically saying that Bitcoin's meteoric rise from $10,000 in 2020 to over $100,000 was an anomaly, and that a significant correction is overdue. He said, "We do a little mean reversion… I think it’s going back there.”
And that's where the community aspect comes in. I've seen the forum debates, the Twitter storms, the Reddit threads filled with both fervent believers and bitter skeptics. It’s a mixed bag, but leaning towards fear. People are genuinely worried, and that fear can be a self-fulfilling prophecy.
The $80,000 Question: Buy, Sell, or HODL?
So, what's the play here? Should you be buying the dip, selling the rip, or simply HODLing on for dear life?
Investment Strategy Considerations
The answer, as always, depends on your individual risk tolerance, investment horizon, and intestinal fortitude. If you're a long-term believer in Bitcoin's fundamental value proposition, then this dip might be a buying opportunity. But if you're a short-term trader looking to make a quick buck, then you might want to wait for more clarity before jumping in.
Key Price Levels to Watch
The key levels to watch are $90K on the downside and $95K on the upside. A sustained break below $90K could trigger another leg down towards $80K, while a break above $95K could open the door for a run towards $100K+. As one article suggests, a further

-
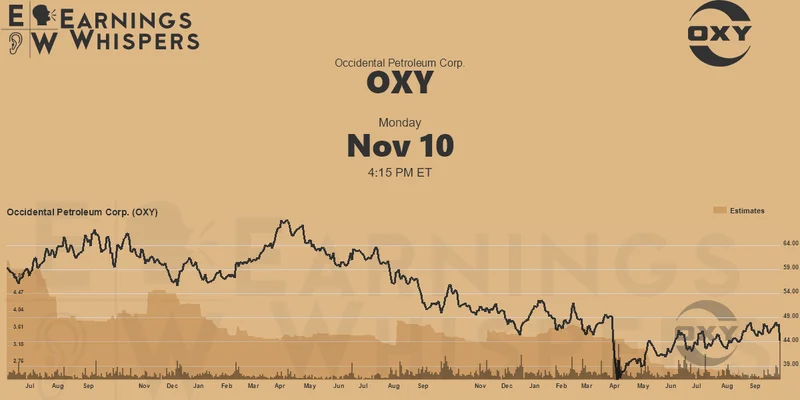
Warren Buffett's OXY Stock Play: The Latest Drama, Buffett's Angle, and Why You Shouldn't Believe the Hype
Solet'sgetthisstraight.Occide...
-

The Great Up-Leveling: What's Happening Now and How We Step Up
Haveyoueverfeltlikeyou'redri...
-

The Future of Auto Parts: How to Find Any Part Instantly and What Comes Next
Walkintoany`autoparts`store—a...
-

Applied Digital (APLD) Stock: Analyzing the Surge, Analyst Targets, and Its Real Valuation
AppliedDigital'sParabolicRise:...
-
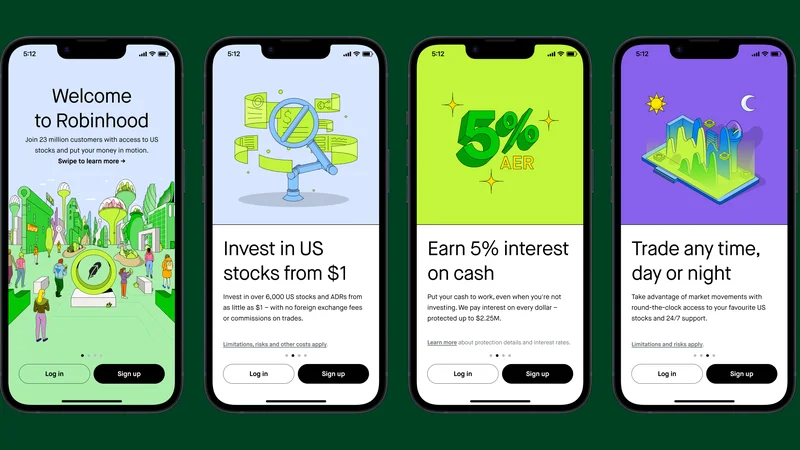
Analyzing Robinhood: What the New Gold Card Means for its 2025 Stock Price
Robinhood's$123BillionBet:IsT...
- Search
- Recently Published
-
- DeFi Post-Crash: Why the Investor Story Is Wrong (Thoughts?)
- Bitcoin's $80K Risk: The Key Level to Watch - Thoughts?
- Why Crypto's Chaos Hides Its Biggest Opportunity (Reddit's Take)
- DeFi Tokens Post-October Crash: What's Really Happening & The 2025 Outlook
- Why Altcoin Season Is Here: Three Unstoppable Forces - Debate Intensifies
- Benny Blanco's Pink Pineapple: Seriously? - Pineapple-Mania Unleashed!
- The Pink Pineapple: The Data Behind the Viral Sensation - Reactions: Obsessed!
- The Unseen Shift: Why Bitcoin Indicators Failed - Debate Intensifies
- The Three Bubble Problem: AI, Crypto, and Debt Explained - Twitter Explodes
- Why Crypto's $15B Expiry Won't Matter - Discussed!
- Tag list
-
- Blockchain (11)
- Decentralization (5)
- Smart Contracts (4)
- Cryptocurrency (26)
- DeFi (5)
- Bitcoin (31)
- Trump (5)
- Ethereum (8)
- Pudgy Penguins (7)
- NFT (5)
- Solana (5)
- cryptocurrency (6)
- bitcoin (7)
- Plasma (5)
- Zcash (12)
- Aster (10)
- nbis stock (5)
- iren stock (5)
- crypto (7)
- ZKsync (5)
- irs stimulus checks 2025 (6)
- pi (6)
- kimberly clark (5)
- uae (5)
- uber stock (5)